


The rise and fall of cost-per-clicks (CPCs) in the last 12 months
Sep 28, 2015
Agencies, Automotive, Finance & Insurance, Marketing Teams, Retail, Telecom, Travel
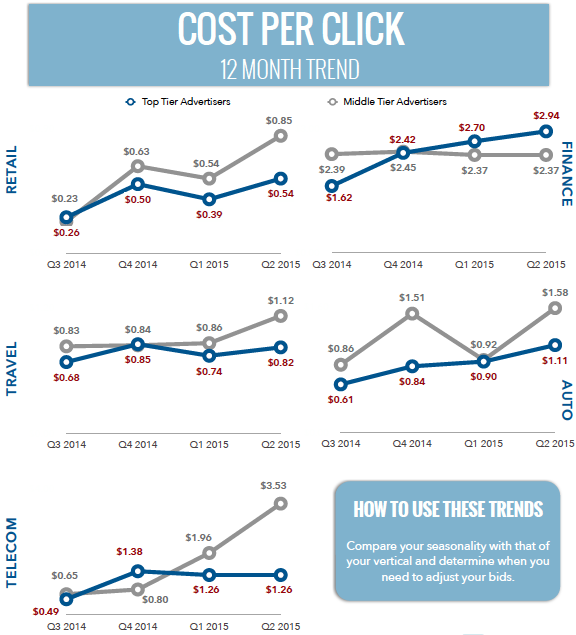 How does seasonality impact your cost per clicks (CPC)? The chart below shows CPC trends for five key PPC verticals---Retail, Finance, Travel, Auto, and Telecom---over the past 4 quarters.
The Search Monitor platform allows search marketers to customize the most representative performance benchmark for their business. For these charts, however, we calculated two of the most helpful ones:
How does seasonality impact your cost per clicks (CPC)? The chart below shows CPC trends for five key PPC verticals---Retail, Finance, Travel, Auto, and Telecom---over the past 4 quarters.
The Search Monitor platform allows search marketers to customize the most representative performance benchmark for their business. For these charts, however, we calculated two of the most helpful ones:
- Top-tier advertisers, in terms of their number of clicks generated in the quarter analyzed
- Middle-tier advertisers, in terms of their number of clicks generated in the quarter analyzed
Have you seen similar seasonality in your CPC data?
 Source: Lighthouse — Google & Bing (Q3 2014-Q2 2015)
Highlights From the CPC Trend Chart
- Finance: There were several quarters were our top-tier advertisers spent more than the middle-tier ones did. This is usually the opposite since the big click-generators have learned how to pay less using advanced technology and lots of agency support.
- Travel: The travel vertical saw the smallest CPC differential between top and middle-tier advertisers. Good news for the smaller advertisers in travel!
- Auto: CPCs demonstrated a very clear trend among middle-tier advertisers, with spikes during Q4 and Q2 when the big auto sales happen.
- Telecom: Telecom saw the highest average CPC of all five verticals analyzed ($3.53 for middle-tier advertisers during Q2). This big spike makes us curious: which advertisers were most responsible for this jump? And, in the case of the Cable and Phone verticals, how much of the click activity comes from the advertisers versus their affiliates and re-sellers?