


Shopping KPI Survey: Conversions—What is your conversion rate?

The Search Monitor recently conducted a survey to aggregate performance metrics for shopping campaigns on Google, Bing and Amazon.
Shopping engines don’t publish any directional stats, and few research papers have been published on this topic. Therefore, benchmarking and goal setting for shopping campaigns is challenging. That’s why we took on the task of anonymously aggregating the top most requested KPI's, including CTR, Conversion Rate, and ROAS for advertisers running shopping campaigns on Google, Amazon and Bing.
Question:
What is your conversion rate?

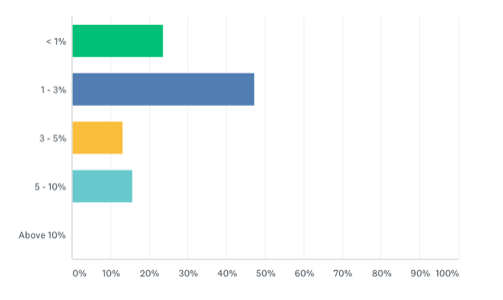
About the stat: Conversion rate represents the average number of conversions per ad interaction, shown as a percentage. Conversion rates are calculated by taking the number of conversions and dividing that by the number of total ad interactions that can be tracked to a conversion. For example, sales/clicks.
Highlights
Over 75% of survey respondents are seeing conversion rates above 1% for their industry, with almost 1/3 seeing rates of 3% or more.
The goal of all online advertisers is to achieve high conversion rates along with low costs per conversion. If this is a goal you are striving for, tracking this metric should be at the top of your list.
Be sure to keep in mind how conversion rates change depending on what industry you’re in. It has been shown that advertisers selling low-cost products in high-competition industries— like apparel—see higher conversion rates than advertisers in high-end industries.
Also important to note is that shopping ads can have different conversion rates than traditional PPC ads. Shopping ads often show better lower funnel conversion rates (last touch attribution) since people coming from shopping ads are more ready to purchase. That means that the conversion from a last touch view might look stronger than search ads.
Just be sure you are comparing apples to apples and focusing on your industry, and the ad format.
Lastly, if you are seeing low conversion rates, don’t just look at the ad. You need to look beyond the ad to make real improvements. To increase conversion, you need to not only improve the ad itself, but also improve your data feed quality, keyword targeting strategy, campaign setup, website design and user experience. All of these are key elements in increasing conversions.
To download the full report, click below.