Trust and Security is Important to us!

This website uses advertising and analytics technologies (including cookies from your device) to measure advertising effectiveness and/or to improve the browsing experience.

By clicking 'Continue to Site', you consent to our use of advertising and analytics technologies (including cookies from your device).

Continue to Site
Exit to Privacy Policy
Close Icon

Customize My Results

Configure the Crawler

Configure the Crawler

Send My Ad Activity

Close Icon
Hidden

Form Content Start

Show Me:
Pick Engines:
National / Local
Name(Required)
Hidden

Section Break

Hidden
This field is for validation purposes and should be left unchanged.

Close Icon

Get a Demo

Instantly schedule a demo and receive a personalized walkthrough of The Search Monitor.

Close Icon
  • Valid info required below for personalized demo
  • Hidden

Close Icon

Build my package

Complete the form on the right to get a customized quote. One of our experts will be in touch with you shortly.

Close Icon
  • Hidden

Category: Retail

The Search Monitor’s New Release: Ad Extension Monitoring for AdWords Paid Search Ads

Ad-extension-monitoring-the-search-monitor

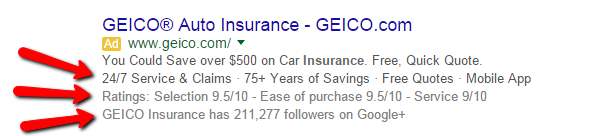
Ad extension monitoring shows marketers exactly how their competitors, partners, and industry leaders use Google’s highly effective ad extensions.

ORLANDO, FL – The Search Monitor, the leader in precision ad intelligence for marketers and affiliate managers, today released ad extension monitoring for Google Adwords’ paid search ads.

Seasonality and CTRs: What’s the connection?

How does seasonality impact clickthrough rates (CTRs)?

The chart below shows CTR benchmarks for five key PPC verticals—Retail, Finance, Travel, Auto, and Telecom—during the past four quarters, and for two important benchmark groups:

  • The Search Monitor’s top-tier advertisers (the group of 10 advertisers who received the most clicks during the quarter)
  • The Search Monitor’s middle-tier advertisers (the group of 10 advertisers whose click volumes represented the middle of the click volume witnessed during the quarter)

How do these trends compare with your clickthrough rate data?

The rise and fall of cost-per-clicks (CPCs) in the last 12 months

How does seasonality impact your cost per clicks (CPC)?  The chart below shows CPC trends for five key PPC verticals—Retail, Finance, Travel, Auto, and Telecom—over the past 4 quarters.

The Search Monitor platform allows search marketers to customize the most representative performance benchmark for their business. For these charts, however, we calculated two of the most helpful ones:

Clickthrough rate (CTR) benchmarks: How do you compare?

While you might think you’re generating the right amount of clicks from your paid ads, how can you be certain without comparing your CTR against industry benchmarks?

The chart below shows CTR benchmarks for five key PPC verticals: Retail, Finance, Travel, Auto, and Telecom. We also included benchmarks for both top-tier and middle-tier advertisers.

How do your CPCs compare to the industry benchmarks?

Cost Per Click is another key performance indicator that every search marketer should monitor on a regular basis.

The chart below shows CPC benchmarks for five key PPC verticals: Retail, Finance, Travel, Auto, and Telecom. Further, we included benchmarks for both top-tier and middle-tier advertisers.

The Search Monitor reveals how industry affects ad rank

The chart below comes from Q2 2015 PPC Benchmark Guide for Search Marketers and provides ad rank data for five important PPC verticals.

For each vertical, we show the ad rank for US Google and Bing searches (desktop and mobile) for both our top-tier and middle-tier advertisers. The Search Monitor’s clients use this benchmark data by tier to ensure that they are performing better than the middle, but aiming for the top.

Which verticals have the highest number of PPC advertisers?

Do you know how many advertisers bid on your keywords?

It’s a crucial benchmark for your performance since it impacts just about every KPI (rank, clicks, spend, share, etc.).

The chart below comes from our PPC Benchmark Guide for Search Marketers and shows the number of advertisers on different verticals of keywords during Q2 of 2015.

5 best practices for the Google Display Network

The Google Display Network (GDN) has been poo-poohed by some digital marketers because it’s not as effective at direct response as its AdWords cousin, paid search, and it doesn’t feature the targeting or programmatic buying capabilities of brand-awareness platforms like Facebook or DSPs.

So, should you ignore the GDN? Emphatically: no. If you haven’t had success with the GDN in the past, it might have less to do with the platform and more to do with some campaign-management mistakes. With that in mind, let’s review 5 GDN best practices that can put you on the path to ROI-positive success.

Four real-life applications for the Search Marketing Visibility Score

Since we launched our new Search Marketing Visibility Score in January, our clients have asked us for a view real-world examples of how they can use it for presentations to senior management, or to their clients (in the case of ad agencies).

Below are four great examples—with real Search Monitor data from February 2015—of how to use the score:

What’s your Search Marketing Visibility Score™?

Search Marketing Visibility Score - Diagram
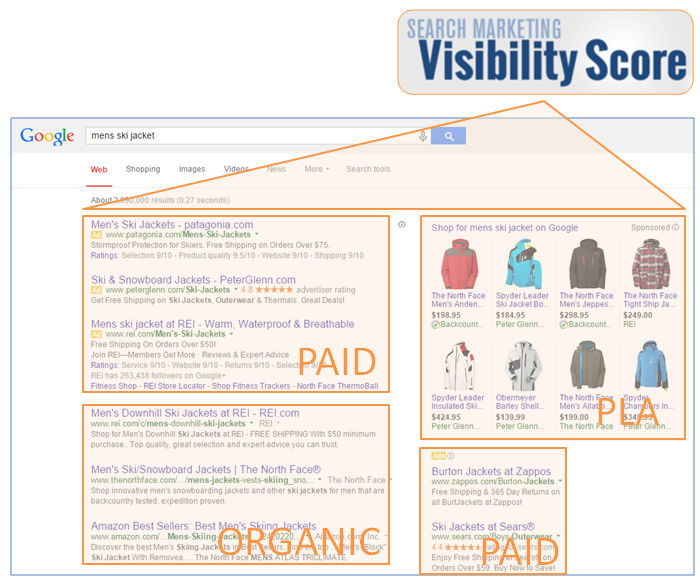
When consumers perform a search and analyze the results, they scan all sections of the page—Paid, Organic, and PLA—to find their answer. They usually don’t care where on the page their answer is, as long as they find it.

Search marketers should rate their performance in the same way, as one holistic measure of how consumers see them on the entire page.

« Previous PageNext Page »
Recommended Reading As an Amazon Associate I earn from qualifying purchases.